The Behavior dashboard, part of the Semrush Traffic & Market Toolkit, shows how competitors’ audiences engage online by revealing their interests, social media preferences, and device usage patterns.
Use this dashboard to understand what drives your competitors' audiences, identify content opportunities, and build detailed user personas based on real behavioral data. The insights help you craft targeted campaigns that resonate with specific audience segments.
Getting started with the Behavior dashboard
The Get Started menu is your entry point into the Semrush Traffic & Market Toolkit. It’s designed to help you quickly enter domains and move into your analysis of their traffic and marketing performance.

You’ll use this page to kick off your analysis — it’s your launchpad into the entire Traffic & Market experience.
If you haven’t created any projects yet, you’ll see a search panel where you can:
- Type in a domain — Start by entering the main domain you’d like to analyze
- Add additional competitors — Use the “+ Add competitors” link to compare multiple sites at once
- Click the “Analyze” button — This will pull up dashboards with data and charts, starting with the Traffic Overview dashboard
If you’ve already entered domains into the toolkit, you’ll see them saved as “Lists” and you can access them anytime.
In this case, you’ll see your saved lists on the Get Started screen. Click any one of them to jump straight into your dashboards and pick up right where you left off.
Use the Create new list button to start a new project whenever you're analyzing a new domain or market.

Note: At any time inside any dashboard, you can select the Competitor list drop-down in the upper left to edit your current list or create a different one without losing your place.
How to use the Behavior dashboard
The Behavior dashboard is interactive and customizable. Use the filters at the top of the page to tailor your analysis and explore behavioral patterns in detail. Start by selecting your date range, location, and device type preferences.
The dashboard begins with a Summary section that provides quick insights into the top behavioral characteristics across your selected domains. Here you can see these audiences’ top characteristics:
- Social media platform
- Interest category
- Device preference
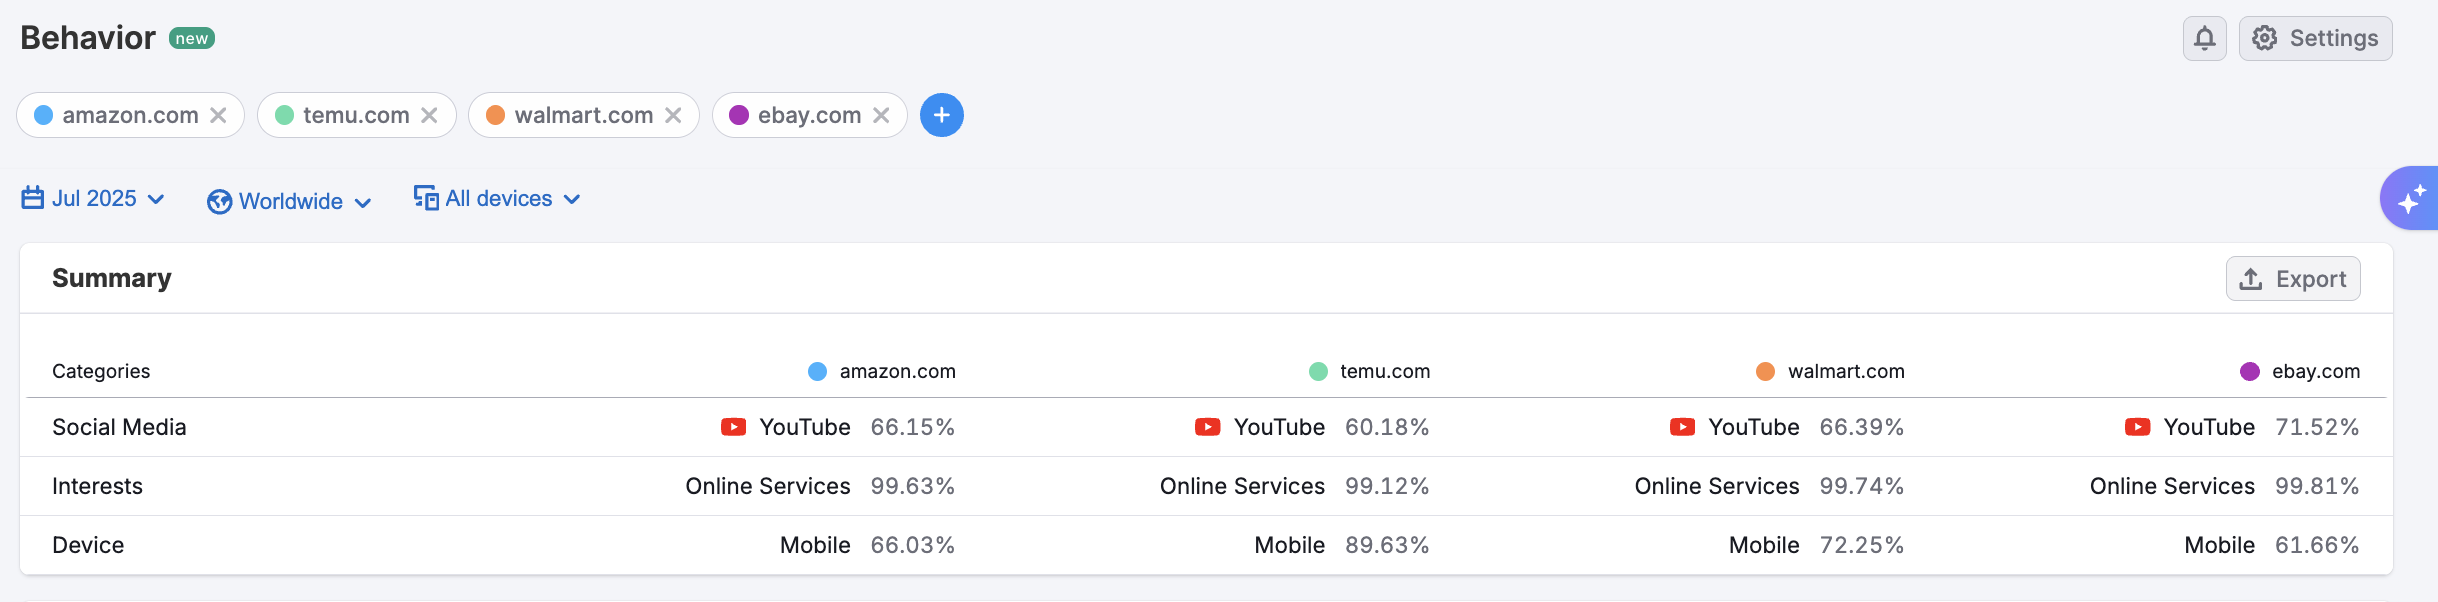
This high-level view helps you spot key behavioral patterns before diving into detailed breakdowns.
Social Media
The Social Media section shows which platforms your competitors’ audiences use most. The data displays both percentage and volume metrics for platforms, including:
- Telegram
- VK
- X (Twitter)
- YouTube
- Flickr
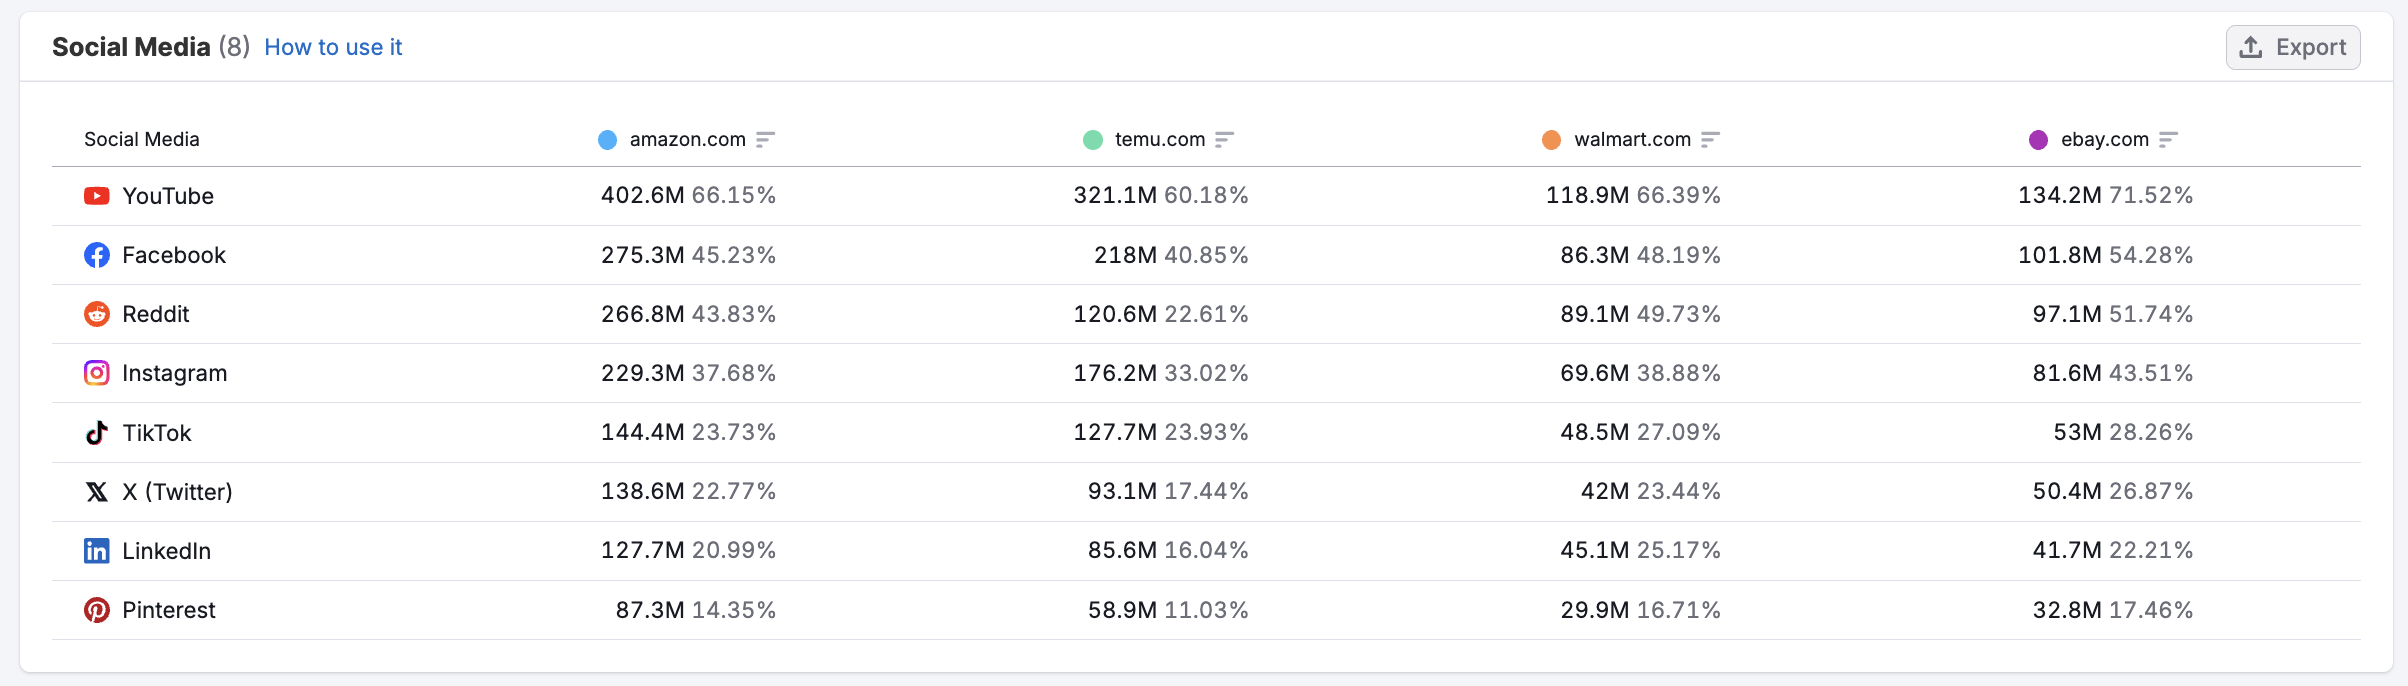
This data can help direct your social media efforts to the platforms that drive the most engagement for similar audiences.
Interests
The Interests section reveals what content topics and industries capture audience attention. Categories include:
- Business & Industrial
- Computers & Electronics
- Construction & Maintenance
- Cosmetics
- Fashion
- Gym
- Health
- Internet & Telecom
- News
- Online Services
- Retail
- Shopping
- Sport
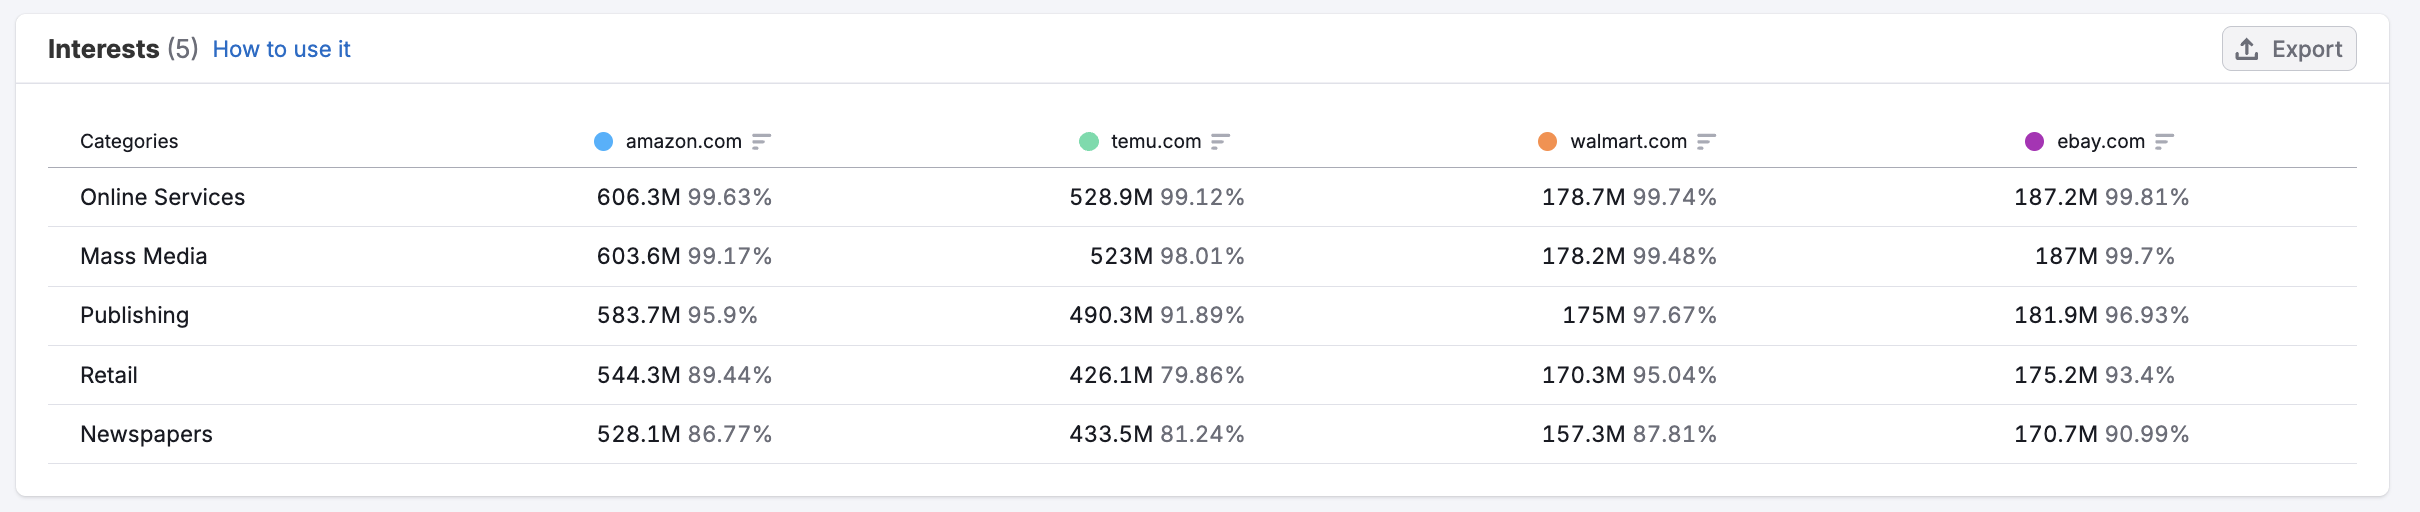
The data shows both the percentage of your audience interested in each category and the total volume — revealing not just which topics to prioritize for content, but also where to pursue partnerships, place ads, launch campaigns, and shape product or service offerings for maximum impact.
Device
The Device section compares desktop and mobile usage, with hover-over bars showing total visits, device breakdowns, and share of total traffic.
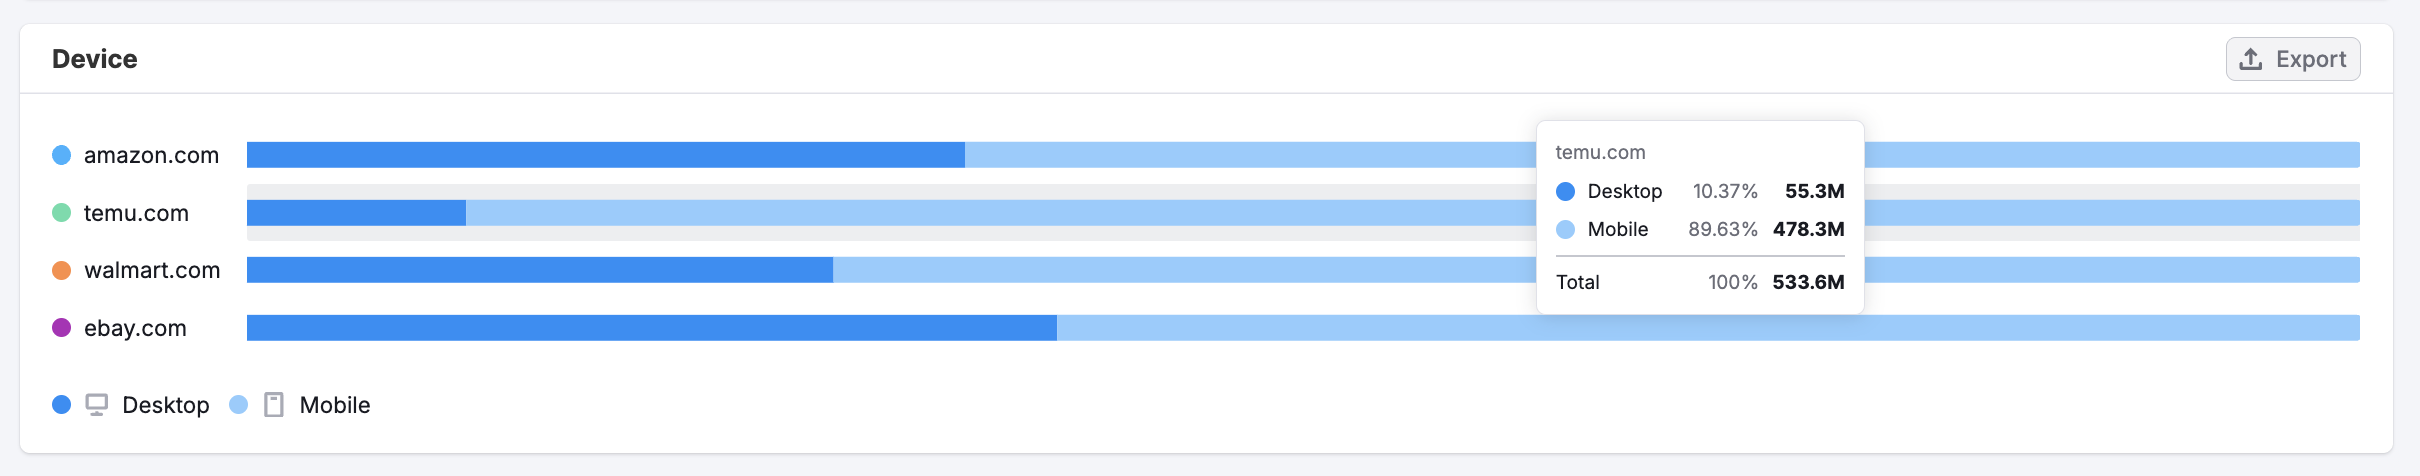
This breakdown helps you understand how to optimize content and campaigns for the device type your target audience uses most.
What can I do with these insights?
The Behavior dashboard provides actionable data to refine your marketing approach and better connect with target audiences. Here's how to apply what you discover:
- Target the right social platforms: Focus your social media efforts on platforms where your target audience is most active. For example, if Instagram is the top platform of your competitor’s audience, prioritize visual content and budget for Instagram advertising.
- Create relevant content: Use interest data to guide content creation. Say your audience shows strong interest in health and wellness. This information should encourage you to develop content that addresses those topics, including reaching out to health and wellness influencers for possible partnerships.
- Optimize for device preferences: Tailor your website experience and ad formats based on whether your audience primarily uses mobile or desktop devices.
- Build detailed personas: Combine social media preferences, interests, and device usage to create comprehensive audience profiles for more targeted campaigns.
- Identify content gaps: Look for interest categories where competitors have weak coverage but audience interest remains high. These represent opportunities to create content that will capture the attention of your competitor’s audience.
By putting these behavioral insights into action, you can create campaigns that connect with audiences on the platforms they prefer, with content that matches their interests, optimized for their device usage patterns.
What related Traffic & Market dashboards should I use?
Combine the Behavior dashboard with these related dashboards for deeper audience understanding:
- Demographics – For age, gender, and geographic data across your competitors’ audiences
- Socioeconomics – To understand income, education, and employment patterns of these audiences
- Audience Overlap – To see how visited domains compare across your competitors’ audiences
- Traffic Overview – To connect behavioral insights with overall traffic performance and engagement metrics
- Sources & Destinations – To understand the user journey and how behavioral preferences influence site navigation
These dashboards work together to create a complete picture of who your audience is, how they behave online, and what motivates their digital choices.